FabCovid19: Automated FACS simulation
To automate the execution and analysis of FACS, we use a FabSim3-based FabCovid19 plugin (https://github.com/djgroen/FabCovid19). It provides an environment for researchers and organisations to construct and modify simulations, instantiate and execute multiple runs for different policy decisions, as well as to validate and visualise the obtained results against the existing data.
Setup
Installing the FabSim3 automation toolkit
To install FabSim3, you need to clone the FabSim3 repository:
git clone https://github.com/djgroen/FabSim3.git
To configure FabSim3 and install required dependencies, go to https://fabsim3.readthedocs.io/en/latest/installation.html which provides detailed instructions.
Installing the FabCovid19 plugin
Once you have installed FabSim3, you can install FabCovid19 by typing:
fabsim localhost install_plugin:FabCovid19
The FabCovid19 plugin will appear in <FabSim3_dir>/plugins/FabCovid19.
Configuration
There are a few small configuration steps to follow:
Go to
<FabSim3_dir>/plugins/FabCovid19.copy
machines_FabCovid19_user_example.ymlasmachines_FabCovid19_user.yml.open
machines_FabCovid19_user.yml.Under the section
localhost, and setfacs_locationvalue with the actual path of FACS in your local PC.localhost: # location of FACS in your local PC facs_location: "<PATH to your local FACS installation>"
Execution
Run a single job
To run a single job, simply type:
fabsim <localhost/remote machine> covid19:<location_scenario>,<TS=transition scenario>,<TM=transition mode>,[outdir=output directory]
- where
config: the name of borough, the full list can be found in https://github.com/djgroen/FabCovid19/tree/master/config_filesmeasures: name of the measures.yml file used, minus the .yml extension. This file should reside in the covid_data subdirectory
Example:
fabsim localhost covid19:config=harrow,measures=measures
Run an ensemble job
To an ensemble simulation of FACS,
fab <localhost/remote machine> covid19_ensemble:config='<area_name>;<area2_name>'[,measures=<list of measures files>]
Note
By default, the measures.yml file will be used in simulations.
Examples:
fabsim localhost covid19_ensemble:config='test',cores=1,replicas=1,measures=measures,starting_infections=10,job_wall_time=0:15:00

fabsim localhost covid19_ensemble:config='harrow'

fabsim localhost covid19_ensemble:config='brent;harrow;hillingdon'
To run an ensemble of parallel runs, using 4 cores per run, you can use a comment like the following examples:
fabsim localhost covid19_ensemble:config='brent',cores=4,replicas=1,simulation_period=500,measures=measures,starting_infections=460,job_wall_time=1:00:00,solver=pfacs

fabsim localhost covid19_ensemble:config='test',cores=4,replicas=1,starting_infections=460,measures=measures,solver=pfacs
If you ran an ensemble job, you may need to do averaging across runs on the output csv files before plotting, in that case, you can type:
fabsim <localhost/remote machine> cal_avg_csv:<location_scenario>,<measures=measure_yml_file>
Examples:
submit an ensemble job, containing 25 identically configured simulations:
fabsim localhost covid19_ensemble:config='brent',measures='measures;measures_nolockdown',replicas=25
submit an ensemble job using QCG-PilotJob:
fabsim localhost covid19_ensemble:config='brent',measures=measures,replicas=25,PilotJob=true
fetch results:
fabsim localhost fetch_results
Calculate averages across runs (not recently tested):
fabsim localhost cal_avg_csv:brent,measures='lockdown_uk'
fabsim localhost cal_avg_csv:brent,measures='lockdown_uk'
Run a validation job
To run a validation simulation, simply type:
fabsim localhost validate_facs
Visualisation
Note
Before you execute any visualisation commands, you should fetch the results using:
fabsim <machine_name> fetch_results
This will create various subdirectories in the <FabSim3_dir>/results directories. the name of these directories will be referred to as results_dir_name in this documentation.
Basic post-processing (No. of infectious people and ICU admissions)
To perform the post-processing on the output results from a single results directory, simply type:
fabsim localhost facs_postprocess:<results_dir_name>
On running this command, you should get a web page that shows a plot like this:
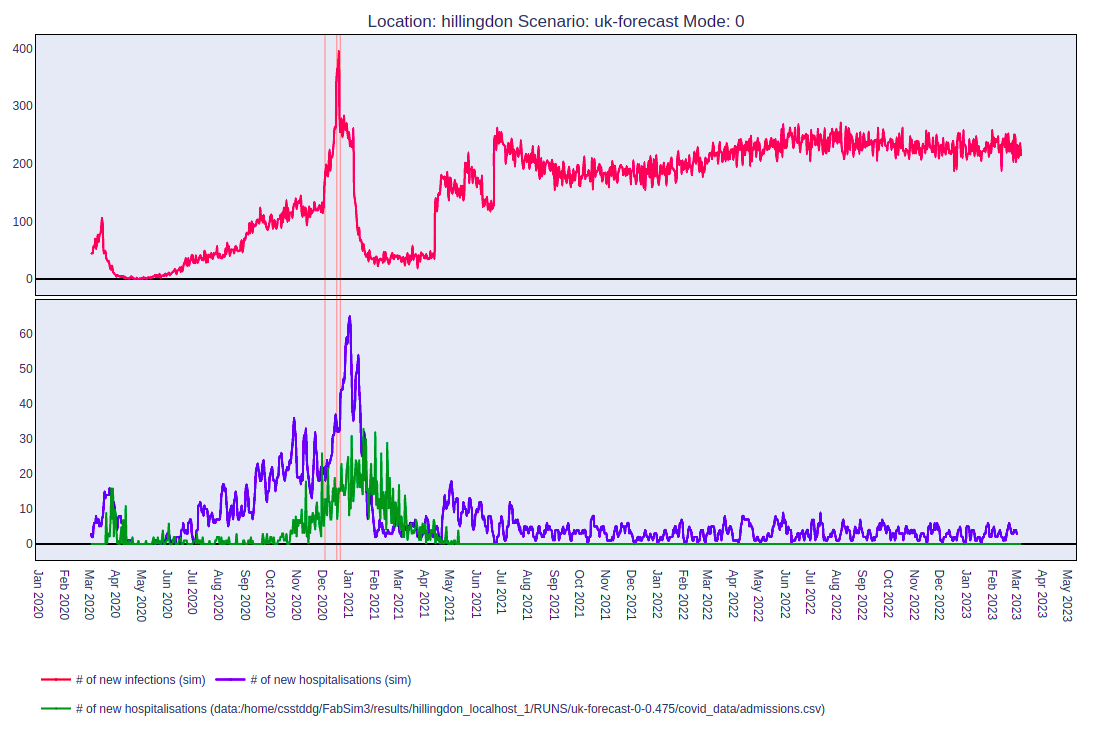
The top and bottom panels of the figure show the number of infectious people and the number of hospitalisations as time progresses.
Comparing the infection-spread by location type
Similarly, you can perform a comparison on infectious spread by location type. To do so, type:
fabsim localhost facs_locationplot:<results_dir_name>
This should give you a web page that shows a plot like this:
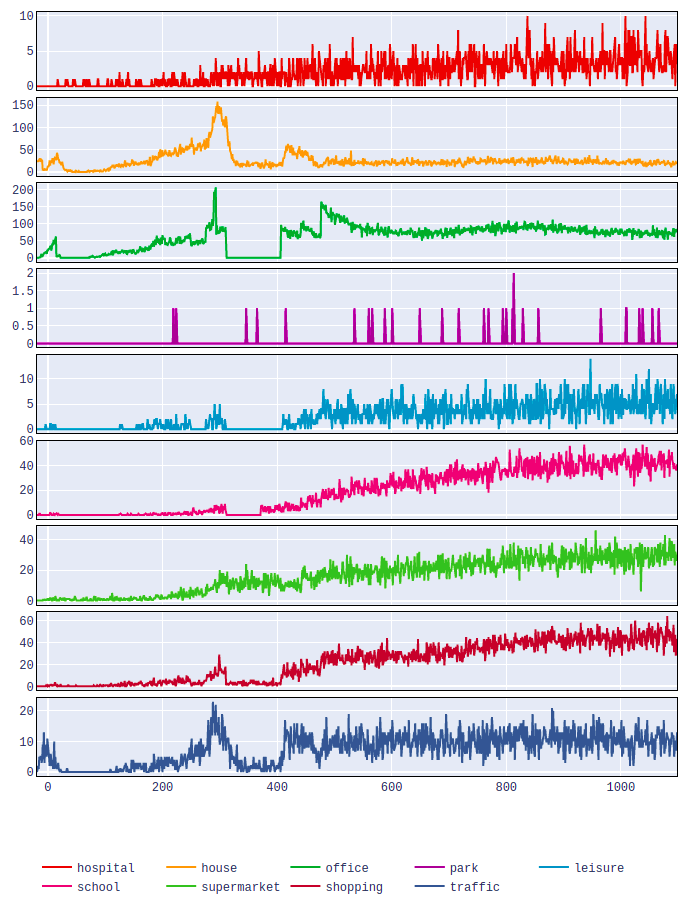
This plot would show the number of infections which occurred in various types of locations on each day.
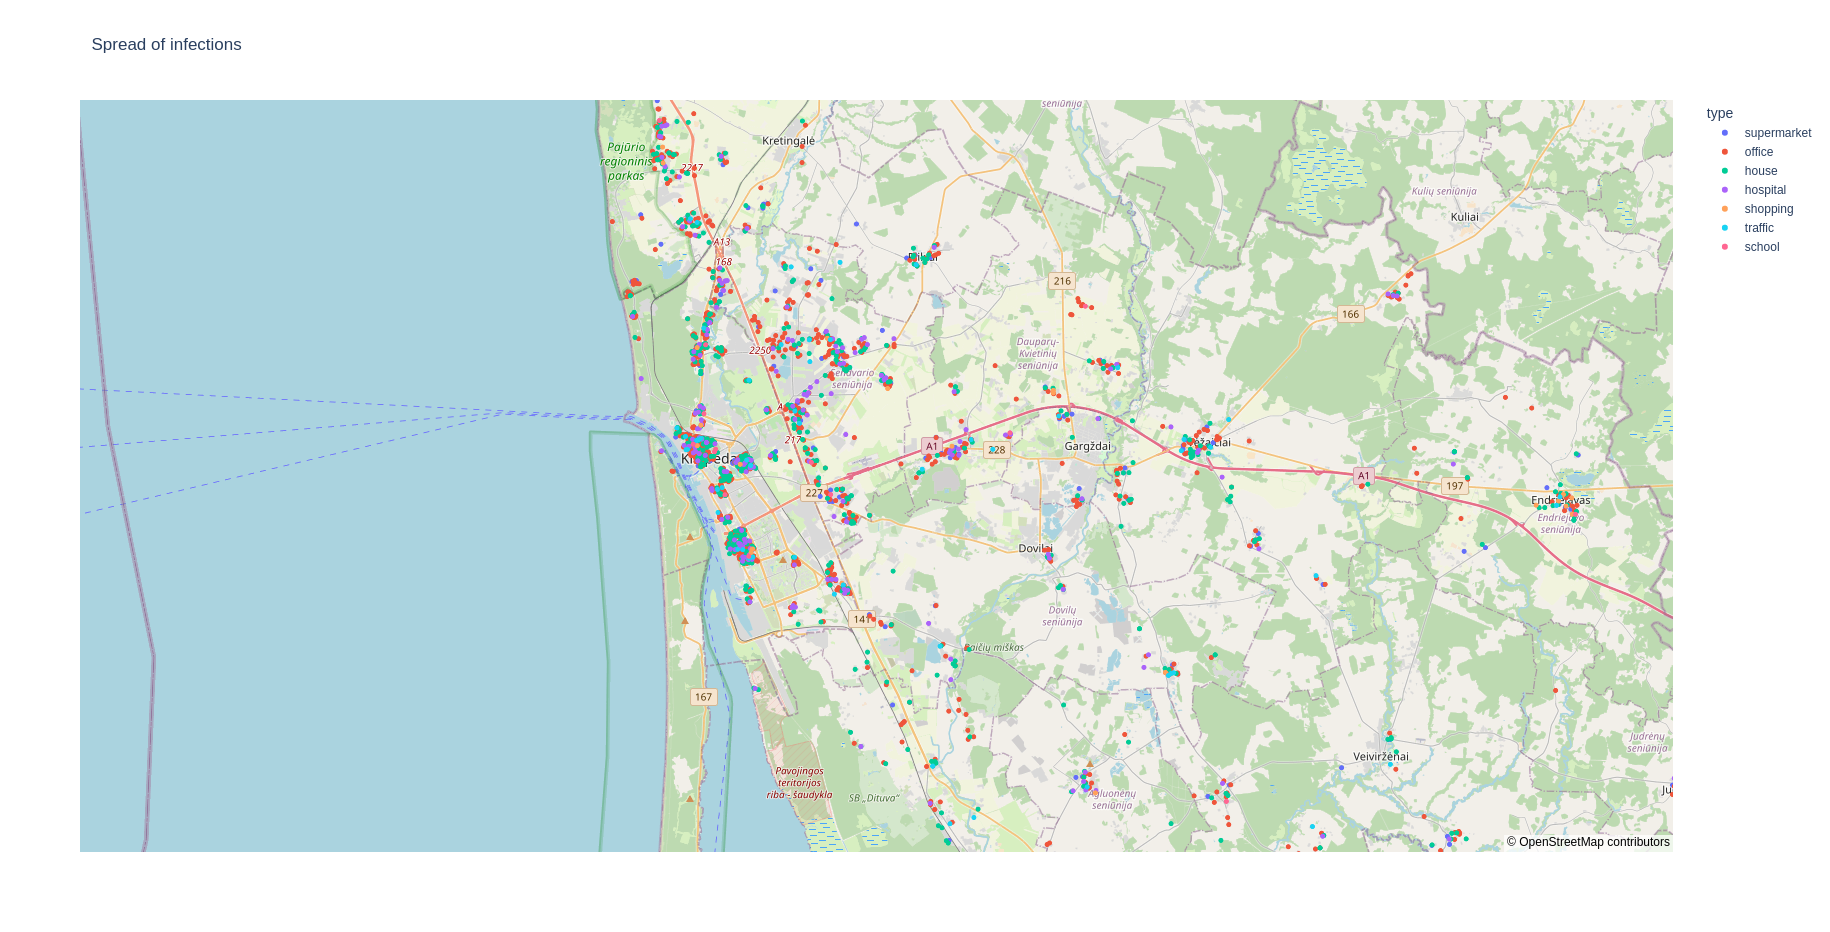
Infections on a map during a period of time
To see the locations where the infections occurred during a period of time, simply type:
fabsim localhost facs_mapspread:<results_dir_name>,<starting_day>-<end_day>
This should give you a web page that shows a plot like this:
To visualise the data for a single day, type:
fabsim localhost facs_mapspread:<day>
Note
The day, starting_day and end_day arguments represent the number of days since the start of the simulation and not the dates.
Buildings on a map
To see all the buildings in a region on a map, type:
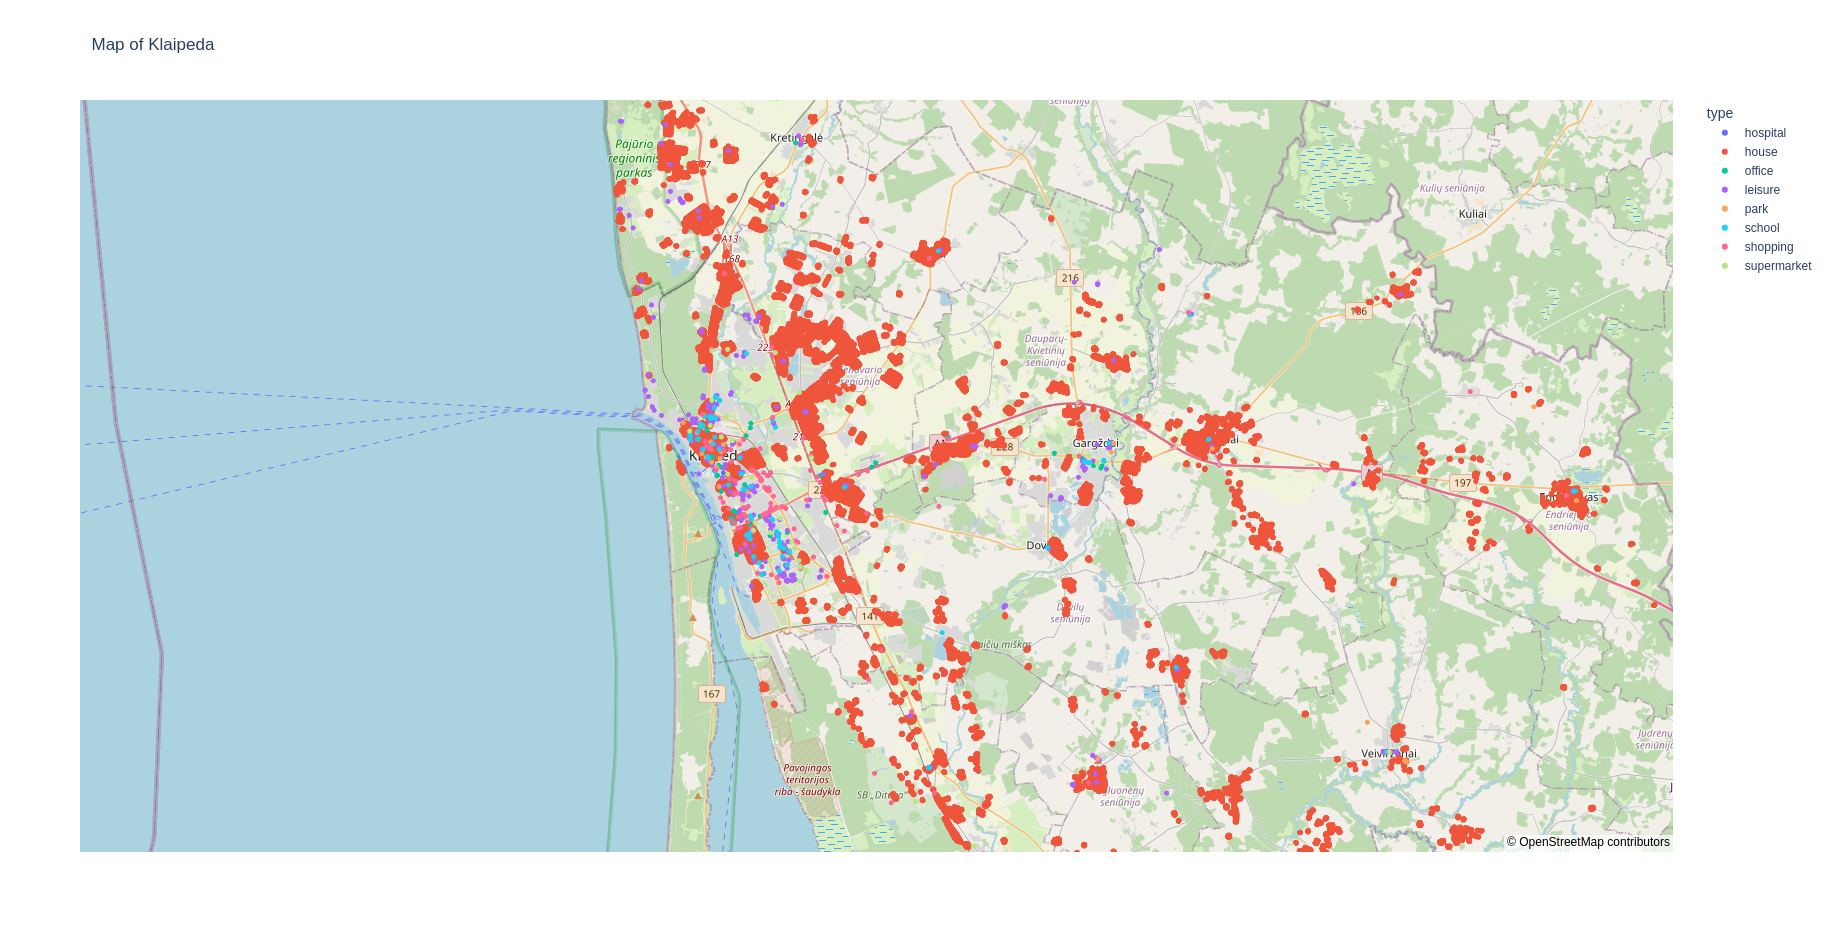
fabsim localhost facs_locationmap:<region_name>,houses=True
This plots all the buildings in the region including the houses. Since, the number of houses is typically very high, it may take some time to render on the web-browser. Therefore, if you do not wish to plot the houses, type:
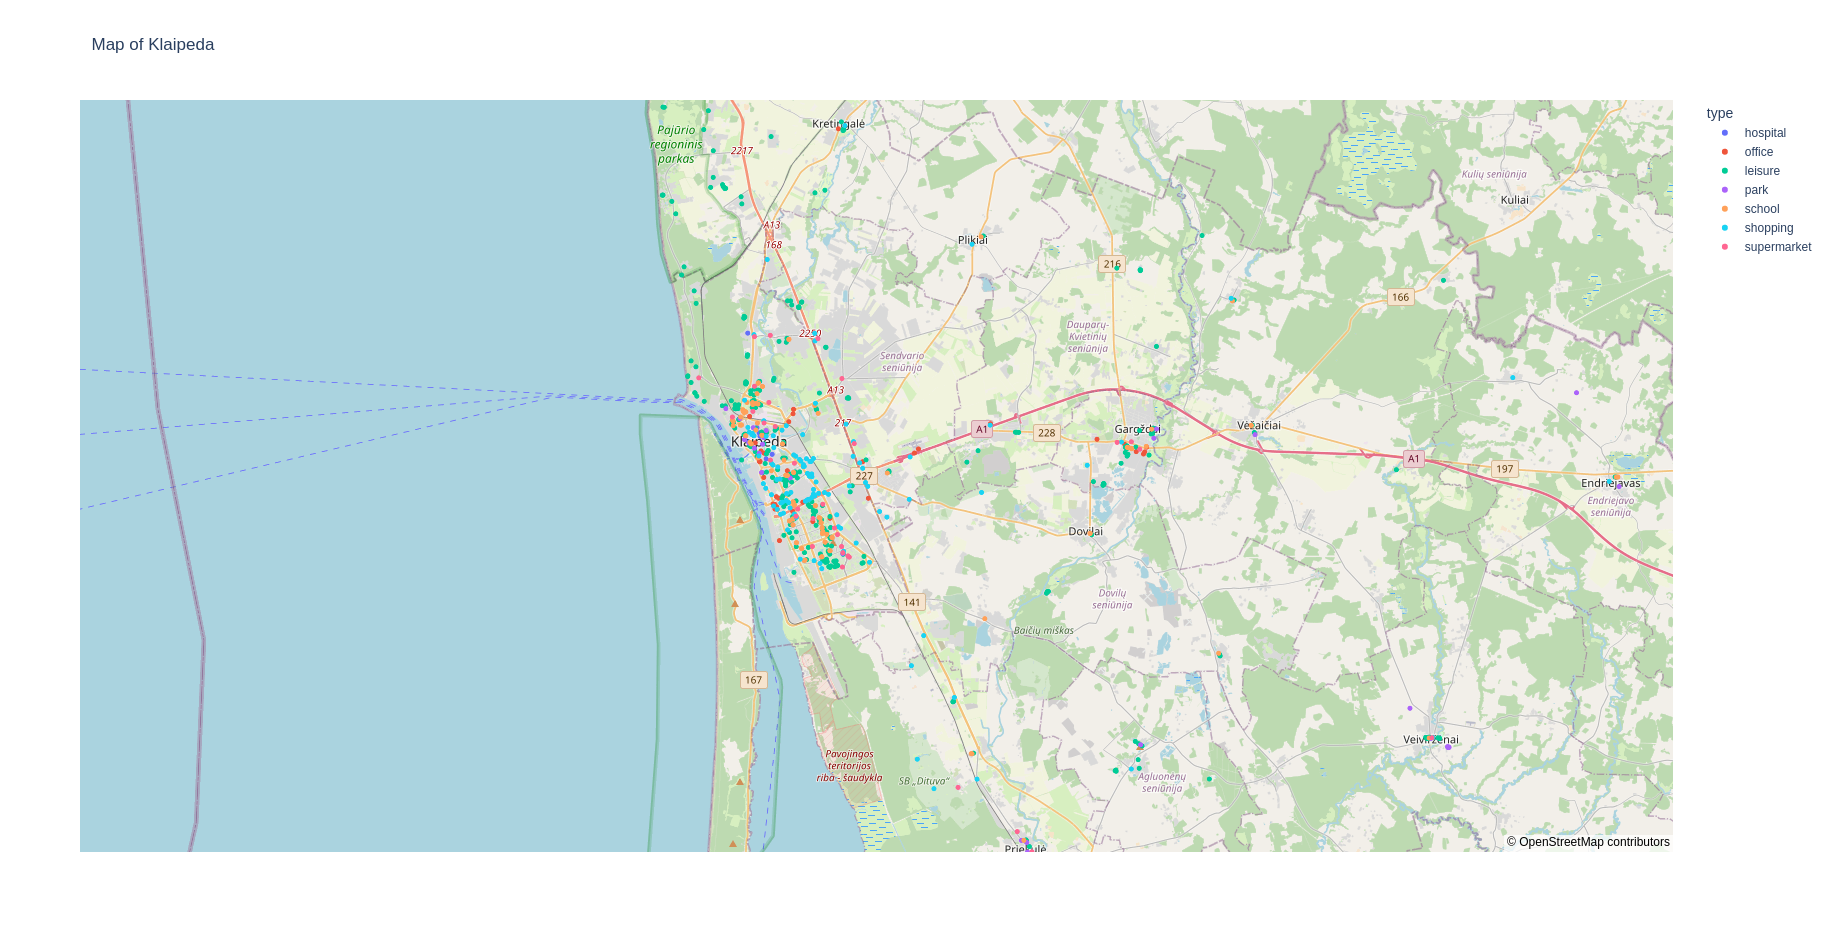
fabsim localhost facs_locationmap:<region_name>
This should give you a web page that shows plots like: